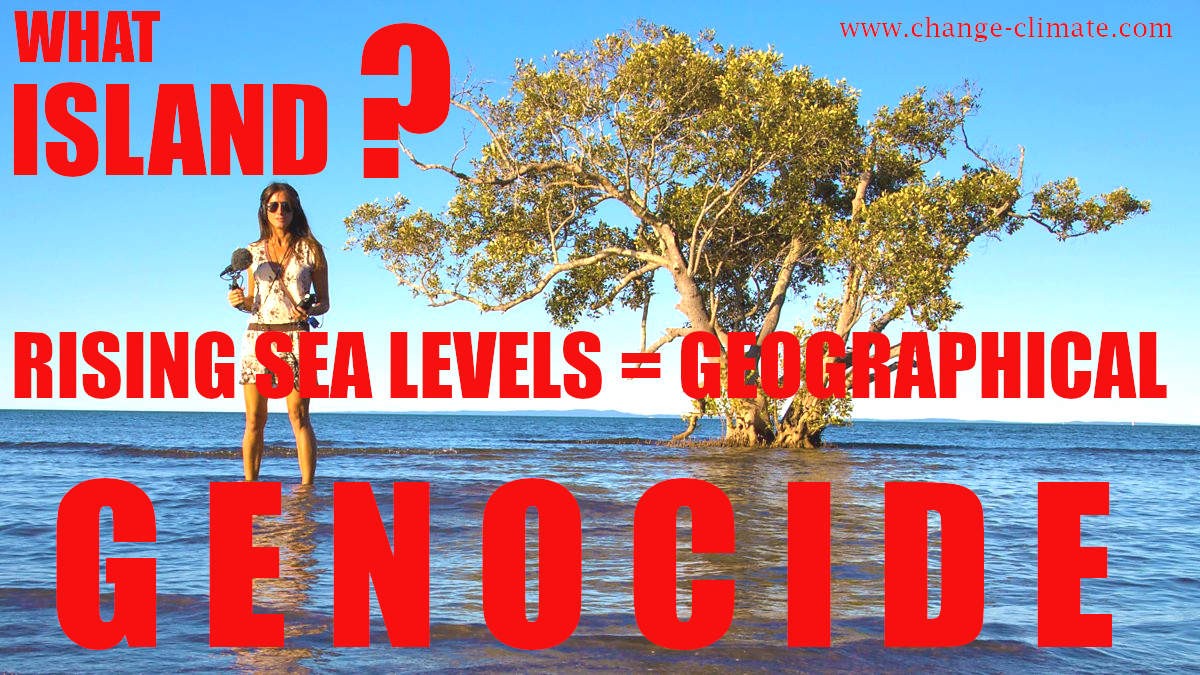
GEOGRAPHICAL
GENOCIDE - Genocide is linked to Eugenics
and Discrimination, in its most extreme form. Examples range from local
authorities persecuting poorer members of society, where they only
want wealthy residents who pay higher taxes, etc. To full on
and systematic industrial scale annihilation, such as the Holocaust.
Cases could be tried by the International Criminal Court on their own
merits, using common sense analogy. For example, where gassing of people
during the Holocaust was systematic industrial scale annihilation. That
is far worse in concept, than pumping CO2 into the atmosphere in total
disregard for the consequences of global warming. As it is known to
cause sea level rise, that would ultimately result in the drowning of
islanders, displacement, and loss of natural habitat. Hence, the level
of inhumanity may be less, but the resultant loss of life and mental
torture, is on a scale that it classes as Geographical Genocide.
POINTS
OF NOTE
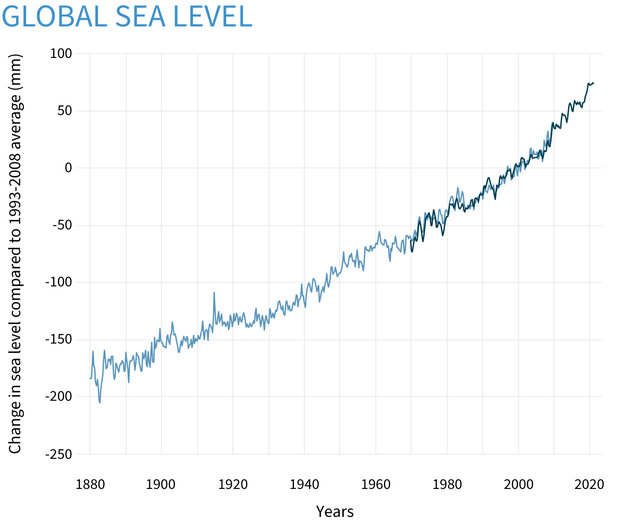
- The sea level has risen 8–9 inches (21–24 centimeters) since 1880.
- In 2020, global sea level set a new record high—91.3 mm (3.6 inches) above 1993 levels.
- The rate of sea level rise is accelerating: it has more than doubled from 0.06 inches (1.4 millimeters) per year throughout most of the twentieth century to 0.14 inches (3.6 millimeters) per year from 2006–2015.
- In many locations along the U.S. coastline, high-tide flooding is now 300% to more than 900% more frequent than it was 50 years ago.
- Even if the world follows a low greenhouse gas pathway, global sea level will likely rise at least 12 inches (0.3 meters) above 2000 levels by 2100.
- If we follow a pathway with high emissions, a worst-case scenario of as much as 8.2 feet (2.5 meters) above 2000 levels by 2100 cannot be ruled out.
As
you drive down the road to your local supermarket in your
petrol and
diesel gas guzzlers, then on return, switch on your electric
kettle powered by coal generating
stations, or hear your gas
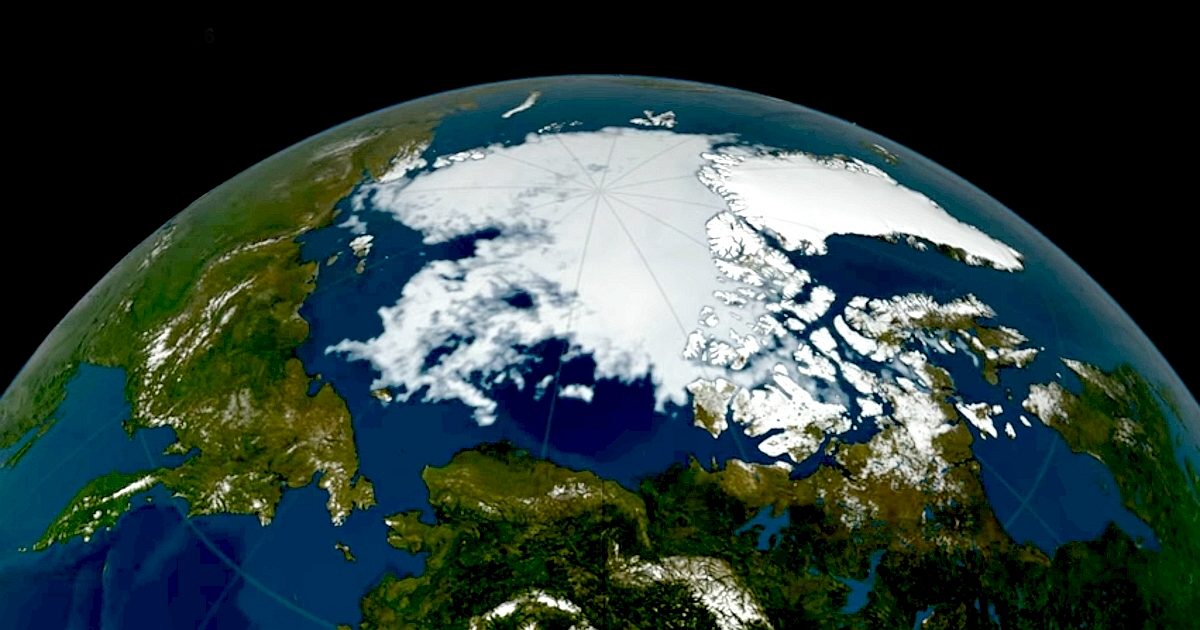
central heating spark up, spare a thought for the polar bears and islanders
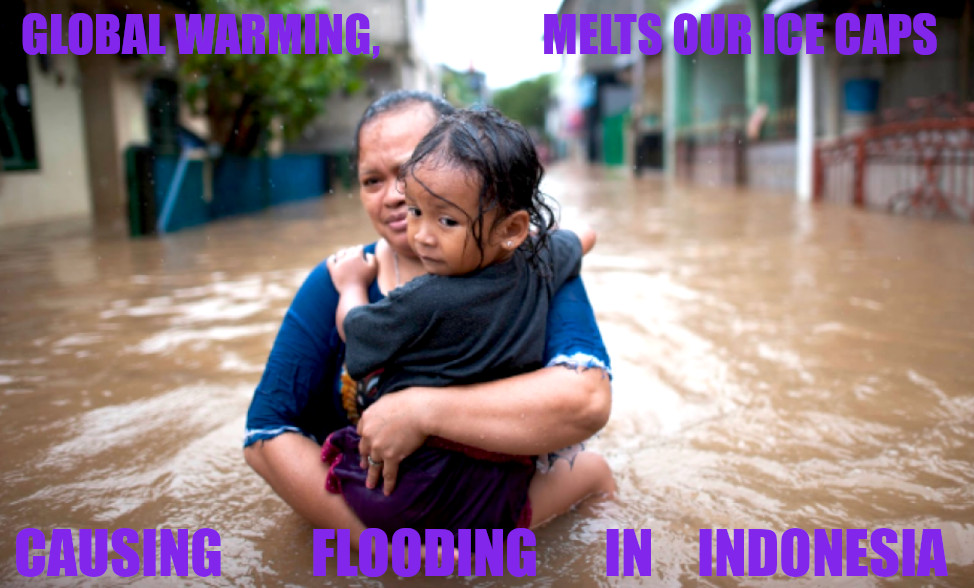
you are making homeless, as global
warming melts the ice caps, and the melting ice raises ocean levels
to flood low lying island nations, and their homes.
Sea levels have risen faster over the last hundred years than any time in the last 3,000 years. This acceleration is expected to continue. A further 15-25cm of sea level rise is expected by 2050, with little sensitivity to greenhouse gas emissions between now and then.
The whole world will never be underwater. But our coastlines would be very different. If all the ice covering Antarctica , Greenland, and in mountain glaciers around the world were to melt, sea level would rise about 70 meters (230 feet).
Widespread areas are likely to see storm surges on top of sea level rise reaching at least 4 feet above high tide by 2030, and 5 feet by 2050.
ISLAND
NATIONS UNDER THREAT - A TO Z
1.
Cabo
Verde, Republic of
2.
Carteret Islands
3.
Fiji, Republic of
4.
Ireland
5.
Hawaii
6. Japan
7.
Kiribati
8.
Maldives
9.
Marshall
Islands, Republic of the
10.
Micronesia,
Federated States of
11.
Palau
12.
Sarichef Island
13.
Seychelles
14. Solomon Islands
15.Tangier Island
16.
Torres Strait Islands
17.
Tuvalu
18.
United Kingdom
MORE
INFO
Global mean sea level has risen about 8–9 inches (21–24 centimeters) since 1880, with about a third of that coming in just the last two and a half decades. The rising water level is mostly due to a combination of melt water from glaciers and ice sheets and thermal expansion of seawater as it warms. In 2020, global mean sea level was 91.3 millimeters (3.6 inches) above the 1993 average, making it the highest annual average in the satellite record (1993-present).
The global mean water level in the ocean rose by 0.14 inches (3.6 millimeters) per year from 2006–2015, which was 2.5 times the average rate of 0.06 inches (1.4 millimeters) per year throughout most of the twentieth century. By the end of the century, global mean sea level is likely to rise at least one foot (0.3 meters) above 2000 levels, even if greenhouse gas emissions follow a relatively low pathway in coming decades.
In some ocean basins, sea level has risen as much as 6-8 inches (15-20 centimeters) since the start of the satellite record. Regional differences exist because of natural variability in the strength of winds and ocean currents, which influence how much and where the deeper layers of the ocean store heat.
Past and future sea level rise at specific locations on land may be more or less than the global average due to local factors: ground settling, upstream flood control, erosion, regional ocean currents, and whether the land is still rebounding from the compressive weight of Ice Age glaciers. In the United States, the fastest rates of sea level rise are occurring in the Gulf of Mexico from the mouth of the Mississippi westward, followed by the mid-Atlantic. Only in Alaska and a few places in the Pacific Northwest are sea levels falling, though that trend will reverse under high greenhouse gas emission pathways.
WHY SEA LEVEL MATTERS IN THE USA
In the United States, almost 40 percent of the population lives in relatively high population-density coastal areas, where sea level plays a role in flooding, shoreline erosion, and hazards from storms. Globally, 8 of the world’s 10 largest cities are near a coast, according to the U.N. Atlas of the Oceans.
In urban settings along coastlines around the world, rising seas threaten infrastructure necessary for local jobs and regional industries. Roads, bridges, subways, water supplies, oil and gas wells, power plants, sewage treatment plants,
landfills -the list is practically endless - are all at risk from sea level rise.
Higher background water levels mean that deadly and destructive storm surges, such as those associated with Hurricane Katrina, “Superstorm” Sandy, and Hurricane
Michael - push farther inland than they once did. Higher sea level also means more frequent high-tide flooding, sometimes called “nuisance flooding” because it isn't generally deadly or dangerous, but it can be disruptive and expensive.
In the natural world, rising sea level creates stress on coastal ecosystems that provide recreation, protection from storms, and habitat for fish and wildlife, including commercially valuable fisheries. As seas rise, saltwater is also contaminating freshwater aquifers, many of which sustain municipal and agricultural water supplies and natural ecosystems.
WHAT IS CAUSING SEA LEVEL RISE
?
Global warming is causing global mean sea level to rise in two ways. First, glaciers and ice sheets worldwide are melting and adding water to the ocean. Second, the volume of the ocean is expanding as the water warms. A third, much smaller contributor to sea level rise is a decline in the amount of liquid water on land
- aquifers, lakes and reservoirs, rivers, soil moisture. This shift of liquid water from land to ocean is largely due to groundwater pumping.
From the 1970s up through the last decade or so, melting and heat expansion were contributing roughly equally to observed sea level rise. But the melting of mountain glaciers and ice sheets has accelerated:
- The decadal average loss from glaciers in the World Glacier Monitoring Service’s reference network quintupled over the past few decades, from the equivalent of 6.7 inches (171 millimeters) of liquid water in the 1980s, to 18 inches (460 millimeters) in the 1990s, to 20 inches (-500 millimeters) in the 2000s, to 33 inches (850 millimeters) for 2010-2018.
- Ice loss from the Greenland Ice Sheet increased seven-fold from 34 billion tons per year between 1992-2001 to 247 billion tons per year between 2012 and 2016.
- Antarctic ice loss nearly quadrupled from 51 billion tons per year between 1992 and 2001 to 199 billion tons per year from 2012-2016.
As a result, the amount of sea level rise due to melting (with a small addition from groundwater transfer and other water storage shifts) from 2005–2013 was nearly twice the amount of sea level rise due to thermal expansion.
FUTURE SEA LEVEL RISE
As global temperatures continue to warm, sea level will continue to rise. How much it will rise depends mostly on the rate of future
carbon dioxide emissions and future
global warming. How fast it will rise depends mostly on the rate of glacier and ice sheet melting.
The pace of sea level rise accelerated beginning in the 1990s, coinciding with acceleration in glacier and ice sheet melting. However, it’s uncertain whether that acceleration will continue, driving faster and faster sea level rise, or whether internal glacier and ice sheet dynamics (not to mention natural climate variability) will lead to “pulses” of accelerated melting interrupted by slowdowns.
In 2012, at the request of the U.S. Climate Change Science Program, NOAA scientists conducted a review of the research on global sea level rise projections. Their experts concluded that even with lowest possible greenhouse gas emission pathways, global mean sea level would rise at least 8 inches (0.2 meters) above 1992 levels by 2100. With high rates of emissions, sea level rise would be much higher, but was unlikely to exceed 6.6 feet higher than 1992 levels.
Both the low-end and “worst-case” possibilities were revised upward in 2017 following a review by the U.S. Interagency Sea Level Rise Taskforce. Based on their new scenarios, global sea level is very likely to rise at least 12 inches (0.3 meters) above 2000 levels by 2100 even on a low-emissions pathway. On future pathways with the highest
greenhouse gas emissions, sea level rise could be as high as 8.2 feet (2.5 meters) above 2000 levels by 2100.
The higher worst-case scenario - which is extremely unlikely, but can’t be ruled out
- is largely due to new observations and modeling on ice loss from Antarctica and Greenland. Since the 2012 report report, new research has emerged showing that some of the more extreme estimates of how quickly those ice sheets could melt were more plausible than they previously seemed.
Along almost all U.S. coasts outside Alaska, the 2017 projections indicate that sea level rise is likely to be higher than the global average for the three highest sea level rise pathways, thanks to local factors like land subsidence, changes in ocean currents, and regional ocean warming. For the densely populated
Atlantic seaboard north of Virginia and the western
Gulf of
Mexico, sea level rise will likely be higher than the global average for all pathways. On the bright side, if future energy choices keep us on one the three lowest pathways, Alaska and the
Pacific Northwest are likely to experience local sea level rise that is less than the global average.
In all cases, however, rising sea levels are increasing coastal flood risk. High-tide flooding is already a serious problem in many coastal communities, and it is only expected to get much worse in the future with continued rising seas.
BANKERS
& STOCK BROKERS - As you count your money aboard your luxury
yacht, wave to all the islanders you have flooded, and hope to hell that
your boat does not sink in these regions, lest they board your life raft
and give you some payback.
GLOBAL
VULNERABILITY TO A FLOODED FUTURE
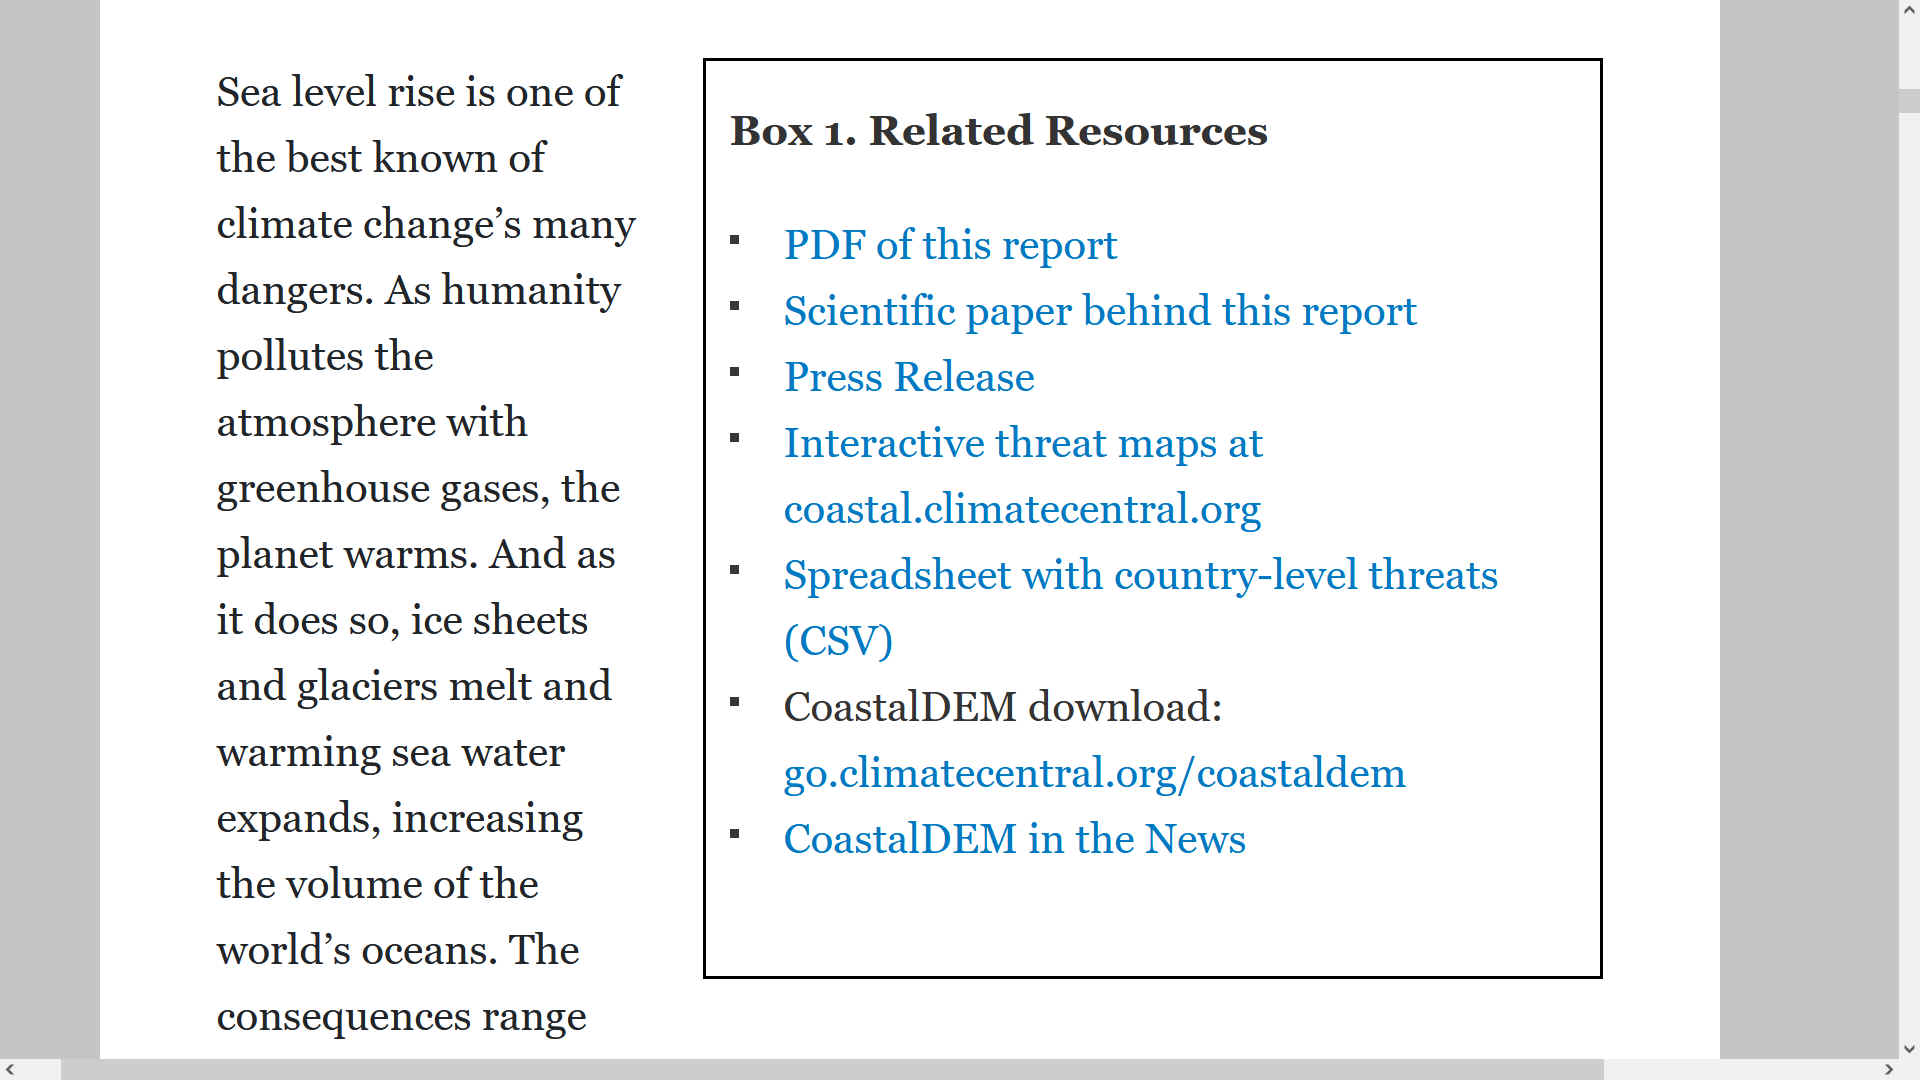
Sea level rise is one of the best known of climate change’s many dangers. As humanity pollutes the atmosphere with greenhouse gases, the planet warms. And as it does so, ice sheets and glaciers melt and warming sea water expands, increasing the volume of the world’s oceans. The consequences range from near-term increases in coastal flooding that can damage infrastructure and crops to the permanent displacement of coastal communities.
Over the course of the twenty-first century, global sea levels are projected to rise between about 2 and 7 feet, and possibly more. The key variables will be how much warming pollution humanity dumps into the atmosphere and how quickly the land-based ice sheets in Greenland and especially Antarctica destabilize. Projecting where and when that rise could translate into increased flooding and permanent inundation is profoundly important for coastal planning and for reckoning the costs of humanity’s emissions.
Projecting flood risk involves not only estimating future sea level rise but also comparing it against land elevations. However, sufficiently accurate elevation data are either unavailable or inaccessible to the public, or prohibitively expensive in most of the world outside the United States, Australia, and parts of Europe. This clouds understanding of where and when sea level rise could affect coastal communities in the most vulnerable parts of the world.
A new digital elevation model produced by Climate Central helps fill the gap. That model, CoastalDEM, shows that many of the world’s coastlines are far lower than has been generally known and that sea level rise could affect hundreds of millions of more people in the coming decades than previously understood.
Based on sea level projections for 2050, land currently home to 300 million people will fall below the elevation of an average annual coastal flood. By 2100, land now home to 200 million people could sit permanently below the high tide line.
Adaptive measures such as construction of levees and other defenses or relocation to higher ground could lessen these threats. In fact, based on CoastalDEM, roughly 110 million people currently live on land below high tide line. This population is almost certainly protected to some degree by existing coastal defenses, which may or may not be adequate for future sea levels.
Despite these existing defenses, increasing ocean flooding, permanent submergence, and coastal defense costs are likely to deliver profound humanitarian, economic, and political consequences. This will happen not just in the distant future, but also within the lifetimes of most people alive today.
GROUND TRUTH
Scientists have long worked to project how quickly various amounts of global warming could raise the level of the world’s oceans—a question about which much uncertainty remains, given the challenges of understanding how ice sheets will respond to the extreme pace of warming they are now experiencing. Yet as researchers have labored over sea level rise models, another factor critical to understanding the world’s vulnerability to rising waters has been largely overlooked. That factor is coastal elevation. In the absence of coastal defenses such as levees, elevation determines the extent to which ocean floods can wash over the land.
Accurately measuring coastal elevation over large areas is neither easy nor cheap. Some countries, such as the United States, use a remote-sensing technology called lidar to reliably map the heights of their coastlines, and publicly release the results. Lidar is relatively expensive, however, typically requiring plane, helicopter, or drone overflights, as well as laser-based equipment. Where lidar data are not available, researchers and analysts rely on one of several global datasets, most typically data sensed from Earth’s orbit through a NASA project known as the Shuttle Radar Topography Mission, or SRTM.
Although SRTM data are freely available online, they are less reliable than lidar. SRTM data measure the tops of features that protrude from the
ground - such as buildings and trees - as well as the ground itself. As a result, SRTM data generally overestimate elevation, particularly in densely forested and built-up areas. In low-lying parts of coastal
Australia, for instance, SRTM data overestimate elevation by an average of 8.2 feet (2.5 meters). Globally, the average overestimate appears to be roughly six feet (two meters). These values match or exceed most of the highest sea level rise projections for the entire century.
In coastal regions, overestimates of elevation produce underestimates of future inundation driven by sea level rise. Understanding the real threat posed by future sea level rise requires a better view of the ground beneath our feet.
That is the purpose of CoastalDEM. Developed using machine learning working with more than 51 million data samples (see methodology), the new dataset is substantially more accurate than SRTM, particularly in densely populated areas—precisely those places where the most people and structures are threatened by rising seas. In low-elevation coastal areas in the United States with population densities over 50,000 people per square mile, such as parts of Boston, Miami, and New York City, SRTM overestimates elevation by 15.5 feet on average. CoastalDEM cuts the average error to less than 2.5 inches.
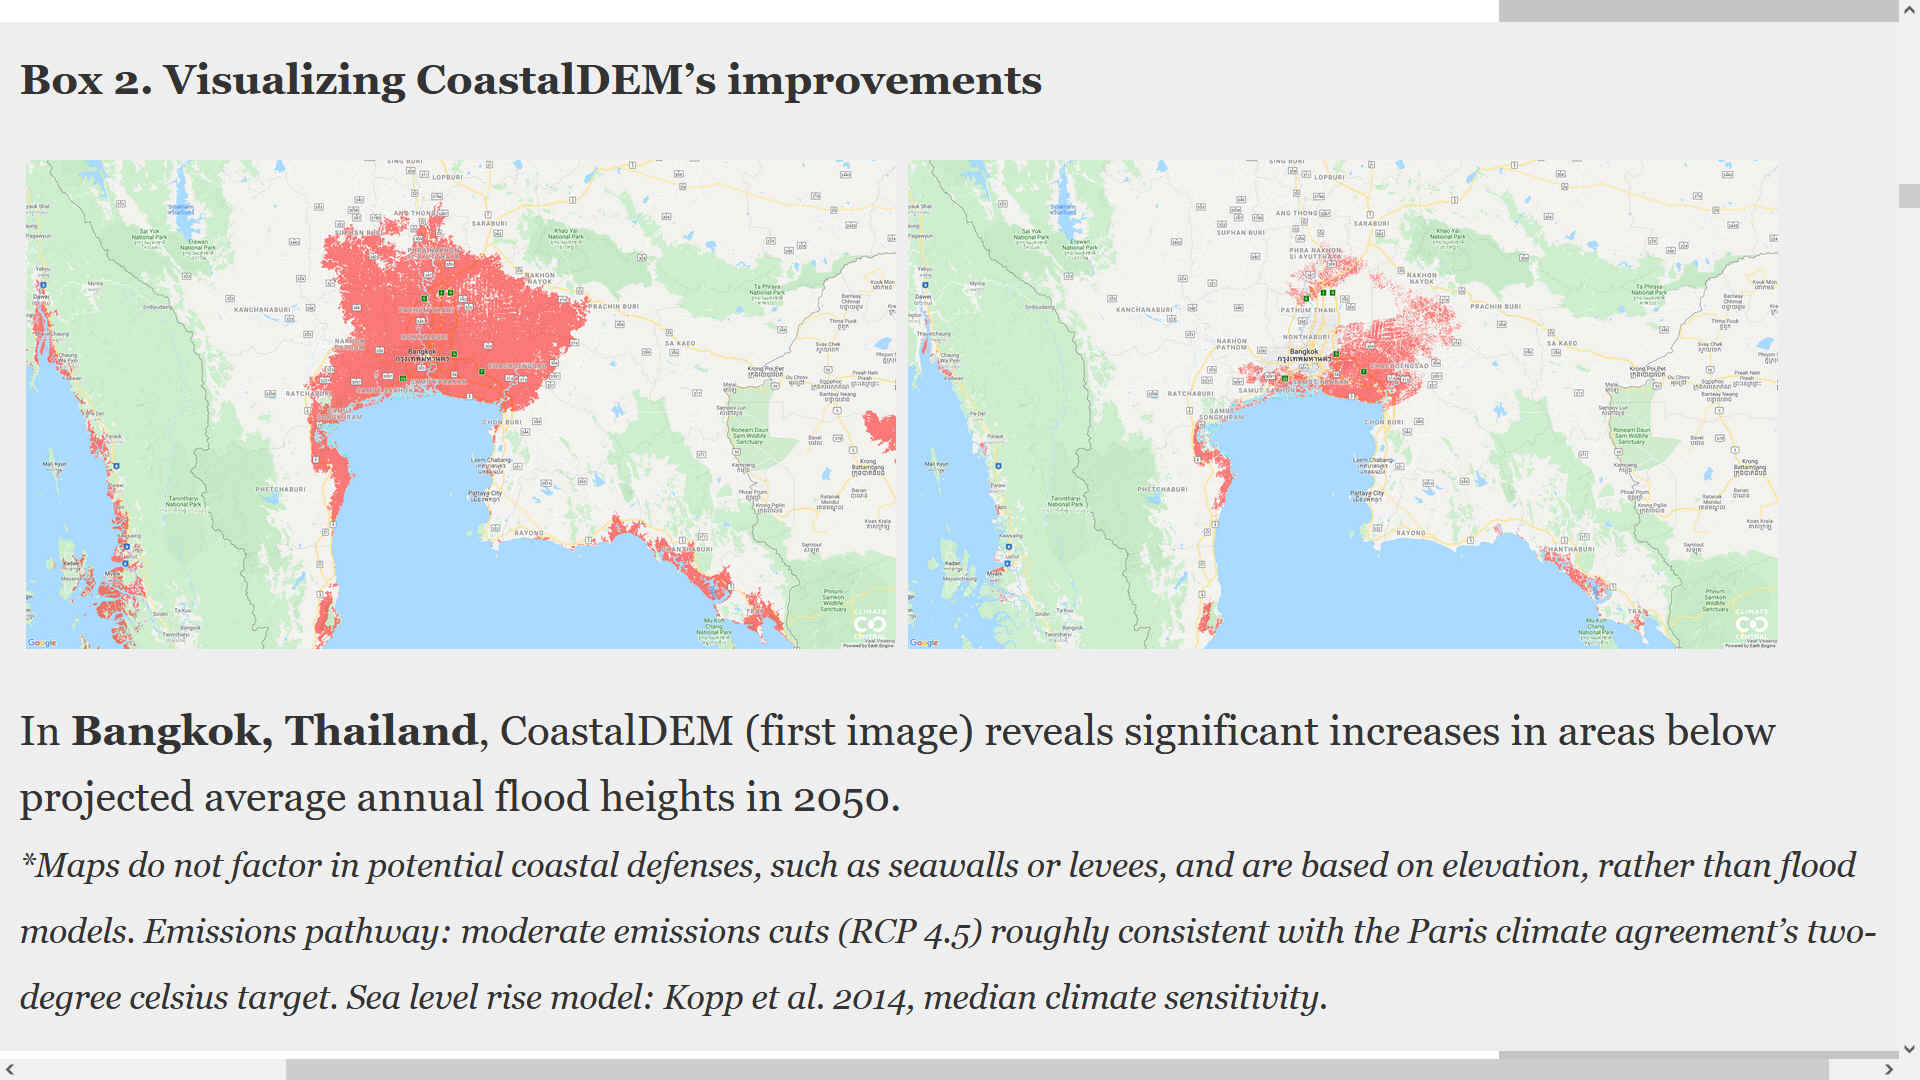
Combining CoastalDEM with sea-level-rise and coastal-flood models produces new estimates of exposure to rising seas around the world (box 2). Those estimates reveal that far more
land - and more people—will be vulnerable to sea level rise during this century than previously believed (chart 1). In fact, using CoastalDEM’s improved data on coastal elevation makes a bigger difference in projected exposure to ocean flooding than does switching from a low-end to a high-end sea-level-rise scenario when SRTM data are used.
THREE DECADES FROM TODAY
Sea level rise is a global story, and it affects every coastal nation. But in the coming decades, the greatest effects will be felt in Asia, thanks to the number of people living in the continent’s low-lying coastal areas. Mainland China, Bangladesh, India, Vietnam, Indonesia, and Thailand are home to the most people on land projected to be below average annual coastal flood levels by 2050 (table 2). Together, those six nations account for roughly 75 percent of the 300 million people on land facing the same vulnerability at midcentury.
A closer look at the cases of mainland China, India, Bangladesh, and Vietnam sheds light on the scope of the problem.
Start with mainland China. By 2050, land now home to 93 million people could be lower than the height of the local average annual coastal flood. Shanghai, which is the country’s most populous city, is projected to be particularly vulnerable to ocean flooding in the absence of coastal defenses (box 4). Low-lying Jiangsu Province, which abuts Shanghai, is also vulnerable. So are Tianjin, the main port for the capital city of Beijing, and the Pearl River Delta region, an urban agglomeration comprising several major mainland cities and the special administrative regions of Hong Kong and Macau (explore map at coastal.climatecentral.org).
Next, consider India’s situation in 2050. By that year, projected sea level rise could push average annual floods above land currently home to some 36 million people. West Bengal and coastal Odisha are projected to be particularly vulnerable, as is the eastern city of Kolkata (box 5; explore map at coastal.climatecentral.org).
Finally, take Bangladesh and Vietnam, where coastal land currently home to 42 million and 31 million people, respectively, could be threatened with saltwater flooding at least once per year at midcentury. By that time, average annual coastal floods are projected to rise higher than a wide swath of Bangladesh, including parts of the cities of Dhaka and Chittagong (box 6; explore map at coastal.climatecentral.org). In Vietnam, annual ocean floods are projected to particularly affect the densely populated Mekong Delta and the northern coast around Vietnam’s capital, Hanoi, including the port city of Haiphong (explore map at coastal.climatecentral.org).
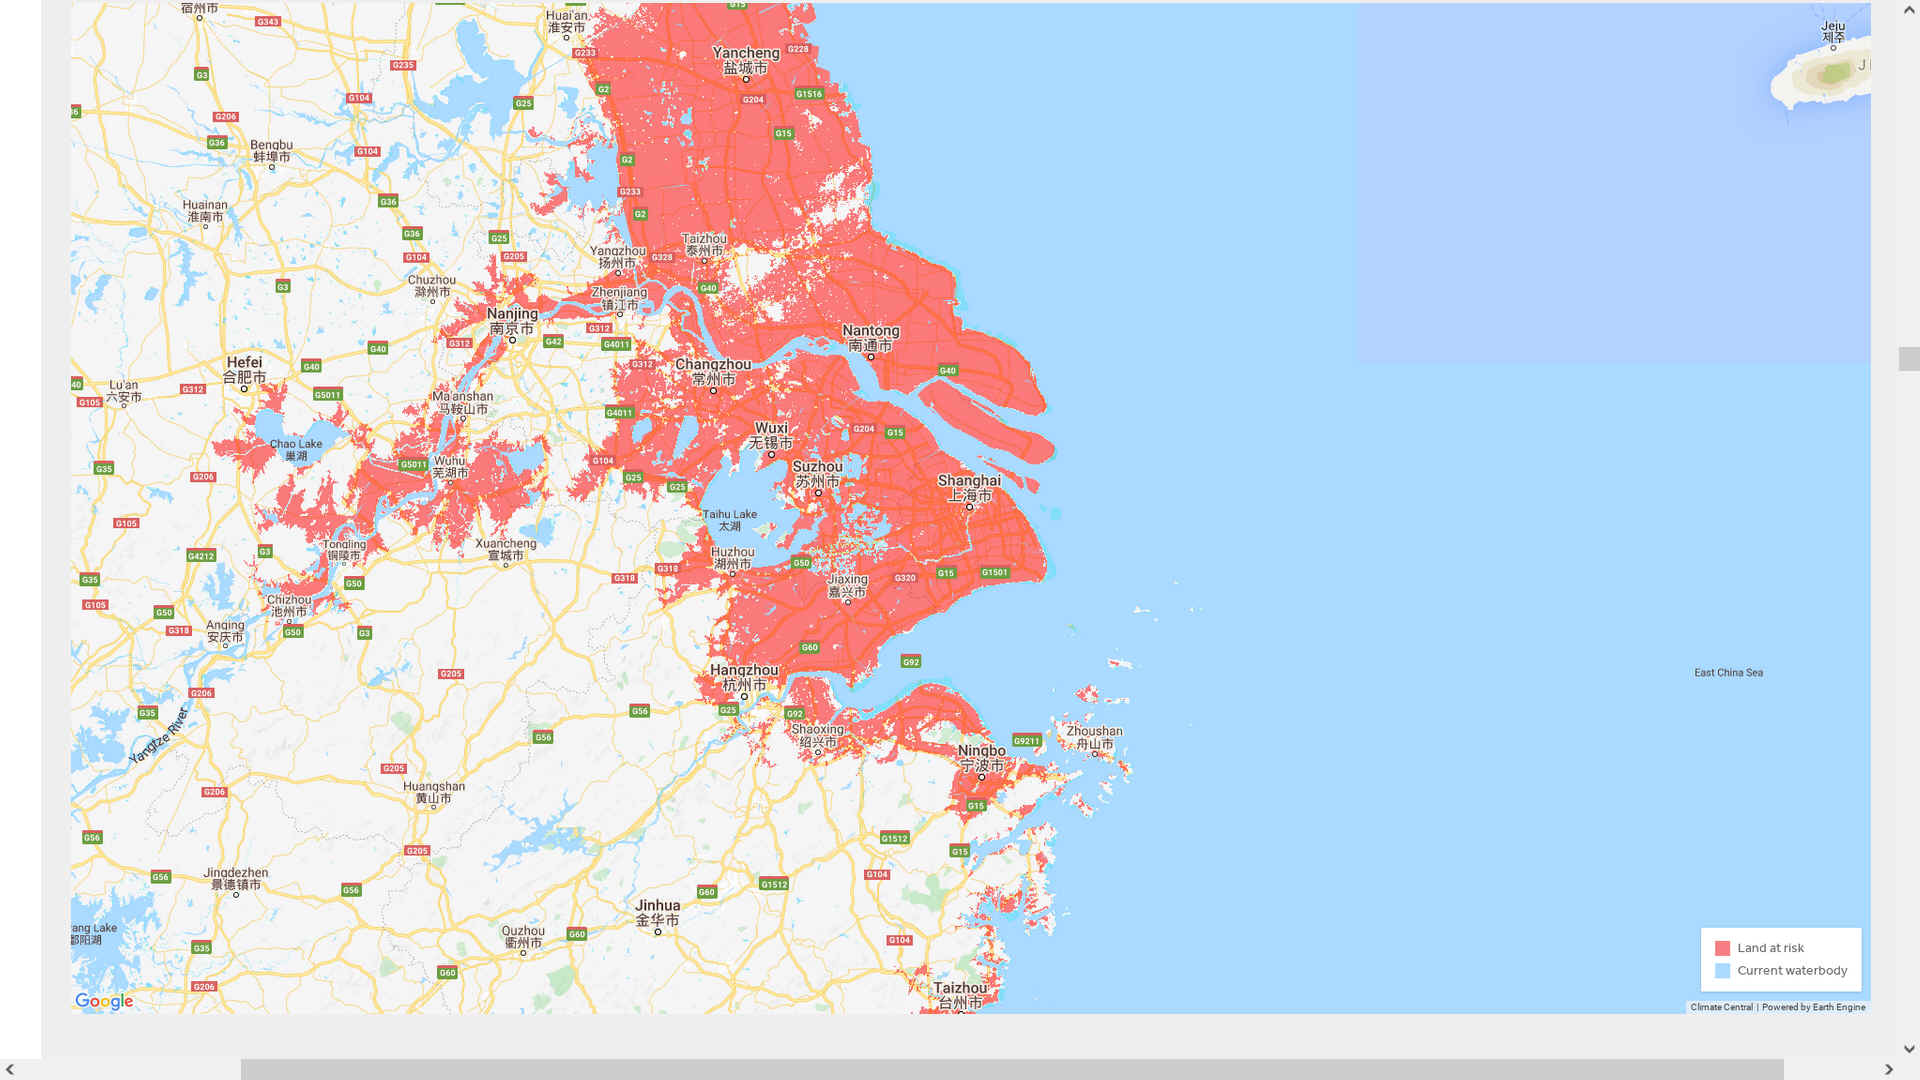
Box 4. Future coastal flood threats in Shanghai, China
- Home to 26 million people, Shanghai is China’s biggest single urban agglomeration. The city is the world’s busiest container port and mainland China’s top financial center.
Annual flood threat zone, 2050 - *Maps do not factor in potential coastal defenses, such as seawalls or levees, and are based on elevation, rather than flood models. Emissions pathway: moderate emissions cuts (RCP 4.5) roughly consistent with the Paris climate agreement’s two-degree target. Sea level rise model: Kopp et al. 2014, median climate sensitivity. Elevation model: CoastalDEM.
PERMANENT LOSSES
As sea levels continue to rise throughout the century, chronic flooding will spread and more land will be permanently lost to the ocean. By 2100, CoastalDEM’s elevation data show, land currently home to 200 million people could fall permanently below the high tide line.
The bad news is again concentrated in Asia. China, Bangladesh, India, Vietnam,
Indonesia, and Thailand are home to the greatest number of people who today live on land that could be threatened by permanent inundation by
2100 - 151 million in total, and 43 million in China alone.
But the danger of permanent inundation is by no means be limited to Asia. In 19 countries, from Nigeria and Brazil to Egypt and the United Kingdom, land now home to at least one million people could fall permanently below the high tide line at the end of the century and become permanently inundated, in the absence of coastal defenses.
The residents of small island states could face particularly devastating losses. Three of every four people in the Marshall Islands now live on land that could lie below high tide in the next eighty years. In the Maldives, the figure is one in three. And well before that land is flooded, residents will face saltwater intrusion into freshwater supplies and frequent flooding. In small islands states, as elsewhere, land could become uninhabitable well before it disappears.
Even as land home to 200 million people today will be threatened by permanent inundation, areas now home to an additional 360 million will face the threat of at-least annual floods, totalling more than half-a-billion people on highly vulnerable land. Under a higher-emissions scenario, and near the tail end (95th percentile) of sea-level rise sensitivity to warming for the model used in this study, land home to 640 million people
today - approaching 10 percent of the world’s population
- could be threatened by the end of the century, either by chronic flooding or permanent inundation.
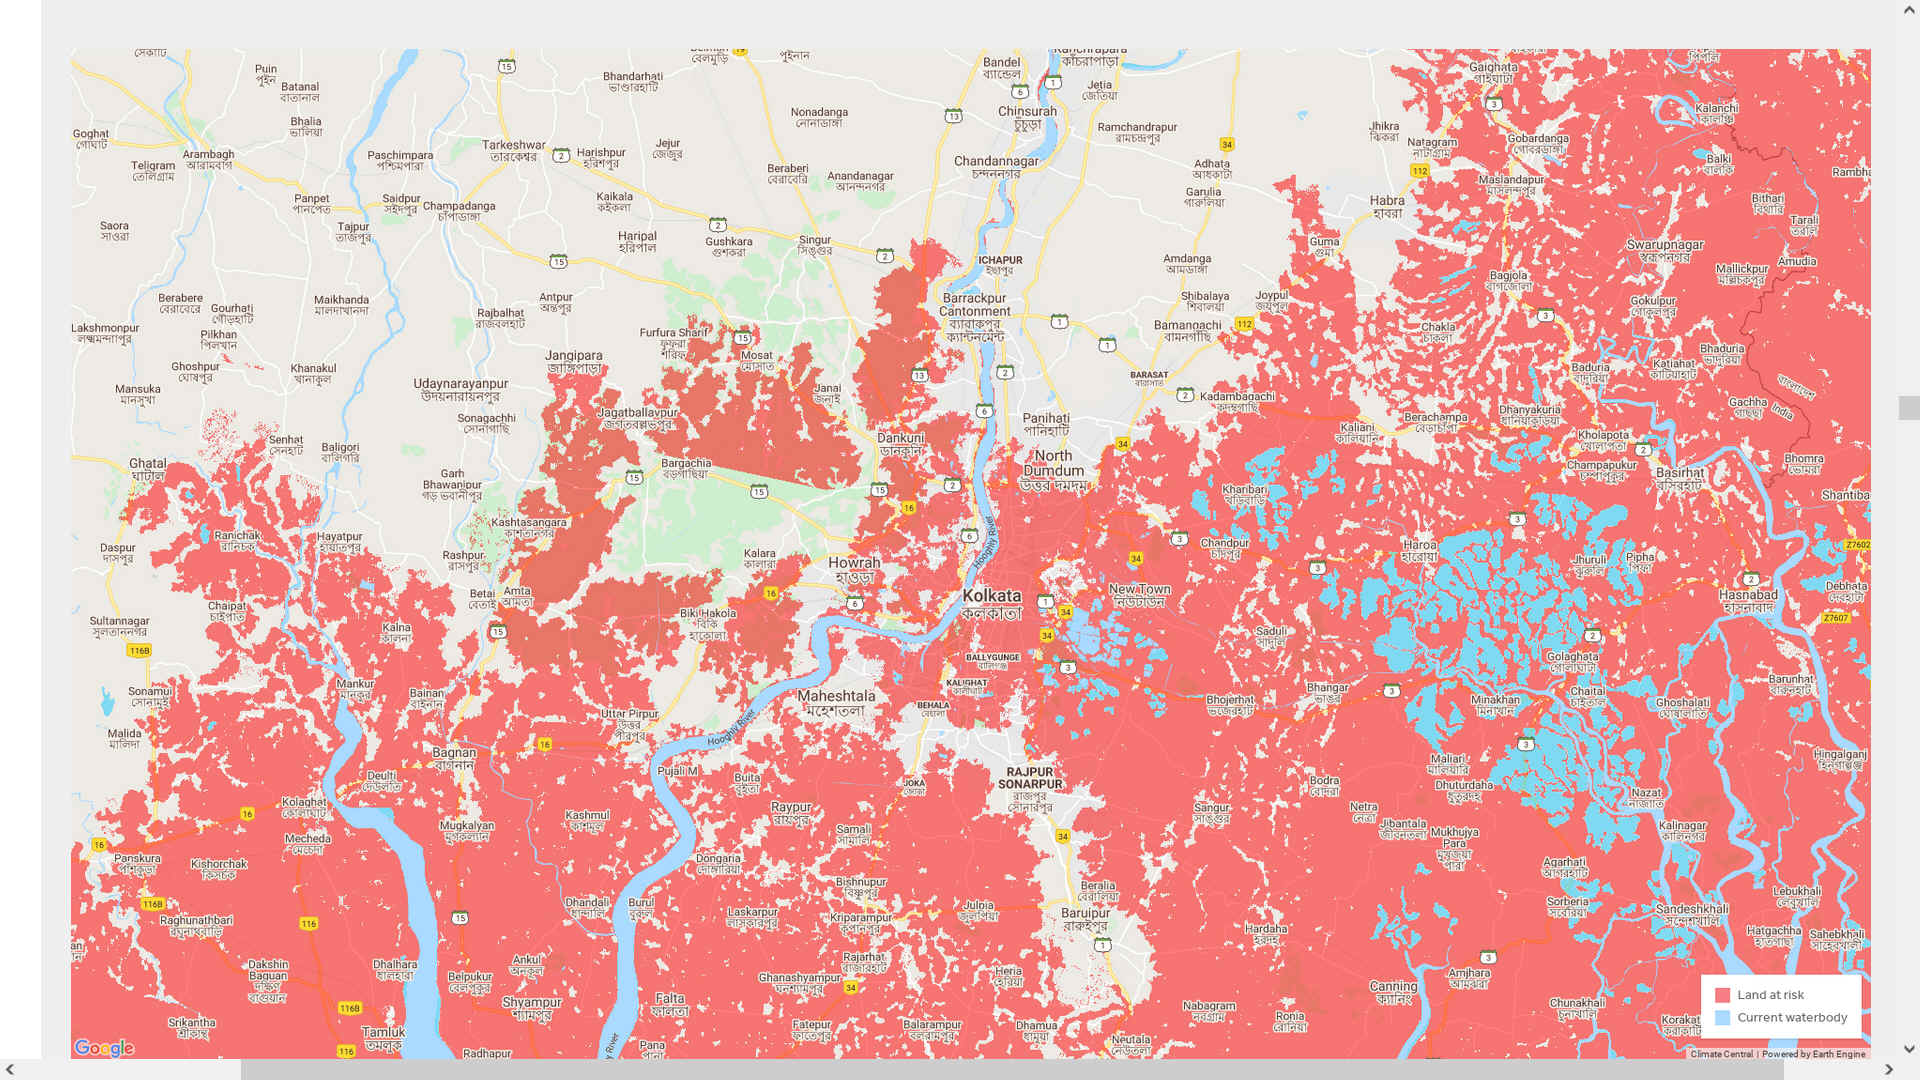
Box 5. Future coastal flood threats in Kolkata, India
- Kolkata is home to 15 million people, and that number is growing. The city already faces flooding driven by heavy rain and other events; by midcentury, much of Kolkata could lie in the annual coastal flood risk zone.
Annual flood threat zone, 2050
AN INHUMAN TOLL
Projecting the specific economic, humanitarian, and political costs of the upward revision in global exposure to sea level rise revealed by CoastalDEM is beyond the scope of this report. But the evidence suggests that those costs will be steep. In the decades ahead, sea level rise could disrupt economies and trigger humanitarian crises around the world.
Estimates of future economic losses from sea level rise vary depending on the amount of climate pollution and subsequent rise projected, as well as other factors, such as whether future population growth, innovation, or migration are considered. Some projections indicate that flooding could cause tens of trillions of dollars in losses each year by the end of the
century - or trillions per year, if extensive adaptation measures are implemented. In practice, the costs will run deeper than immediate physical damage to buildings and infrastructure, or the costs of adaptation, which will never be perfect. Flooding can be costly because it can displace productive local economies dependent on density and convenient coastal locations. It could also disrupt global supply chains by limiting access to ports and coastal transportation.
Take the case of the coastal provinces of China, the country that today is home to more people who live on land vulnerable to chronic flooding at midcentury than any other. In recent decades, China’s coastal provinces have attracted millions of migrants from the country’s interior and have become important centers in the global economy. Jiangsu Province, China’s most densely populated province, could be highly vulnerable to chronic ocean flooding in just thirty years. The same is true of Guangdong Province, another coastal economic powerhouse (explore map at coastal.climatecentral.org). Economic losses in China would matter for the rest of the world: the country is responsible for more than a quarter of the growth in today’s global economy and is projected to remain the world’s biggest economy, in purchasing power parity terms, in 2050.
Sea level rise could also produce humanitarian crises by stripping millions of people of their homes and traditional livelihoods. The developing countries least able to protect their residents through coastal defenses or planned evacuations could be particularly
vulnerable - and are responsible for just a small fraction of global emissions.
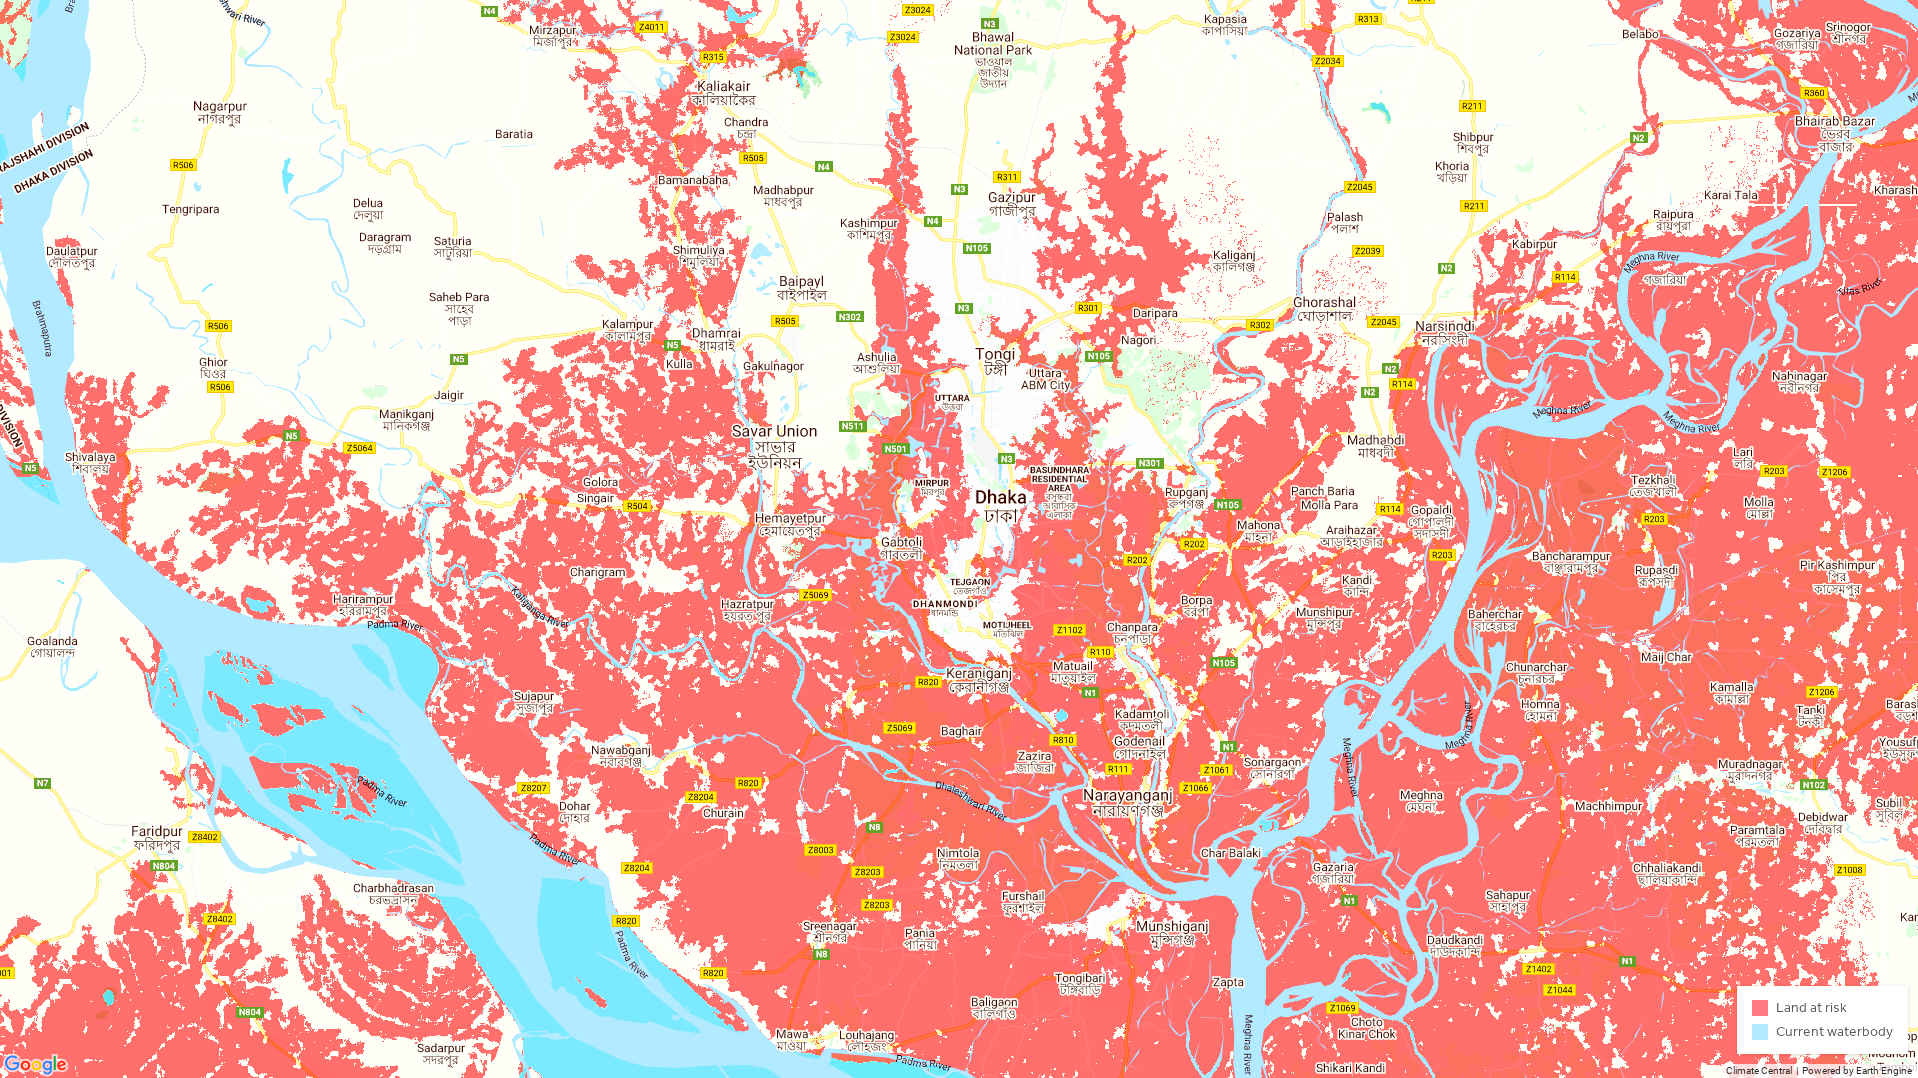
Box 6. Future coastal flood threats in Dhaka, Bangladesh
- Dhaka is Bangladesh’s capital and largest city. Already home to a growing number of internal migrants who have left coastal settlements behind, Dhaka is itself projected to see significant saltwater flood risks in the coming decades.
In Bangladesh, where per-capita emissions and per-capita GDP are more than thirty times lower than in the
United
States, flooding-driven displacement is not just a future prospect; it has already arrived. CoastalDEM data show that the problem is set to worsen. Today, one in every four Bangladeshis lives on land that could flood at least once a year, on average, by 2050. (Even the country’s most infamous refugee crisis could be exacerbated by sea level rise: in recent years, hundreds of thousands of Rohingya people have fled violence in neighboring Myanmar, many settling in the low-lying region south of
Chittagong - an area that could itself be vulnerable to at-least-annual ocean flooding by 2050, projections based on CoastalDEM show.)
Sea level rise could have wide-ranging political consequences. Coastal displacement could shrink local tax bases, straining municipalities’ abilities to pay for public goods such as education. The retreat of the world’s coasts could affect countries’ near-shore maritime claims, encouraging international disputes over
fisheries and other ocean resources. And in states around the world, mass displacement could shape national politics. The recent migration that has figured so prominently in recent European elections pales in comparison to the potential displacements of the coming decades, when many millions of people could flee rising seas around the
world - both across borders, and within them. Drought, extreme heat, and the other dangers of climate change could displace many more.
Deep, immediate cuts to global emissions would modestly reduce the danger posed by rising seas this century. Such cuts would reduce the total number of people threatened by annual flooding and permanent inundation at the end of the century by 20 million, relative to moderate emissions cuts made roughly in line with the Paris agreement. Notably, the benefits of deep emissions cuts would reach far beyond sea level rise, reducing the danger posed by climate change’s many other risks. If governments seek to limit future impacts from ocean flooding, they could also avoid new construction in areas at high risk of inundation, while protecting, relocating, or abandoning existing infrastructure and settlements. Sea level rise is a near term danger: today’s communities must make choices not just on the behalf of future generations, but also for themselves.
NB - Please note, these articles are for educational and communication purposes only.
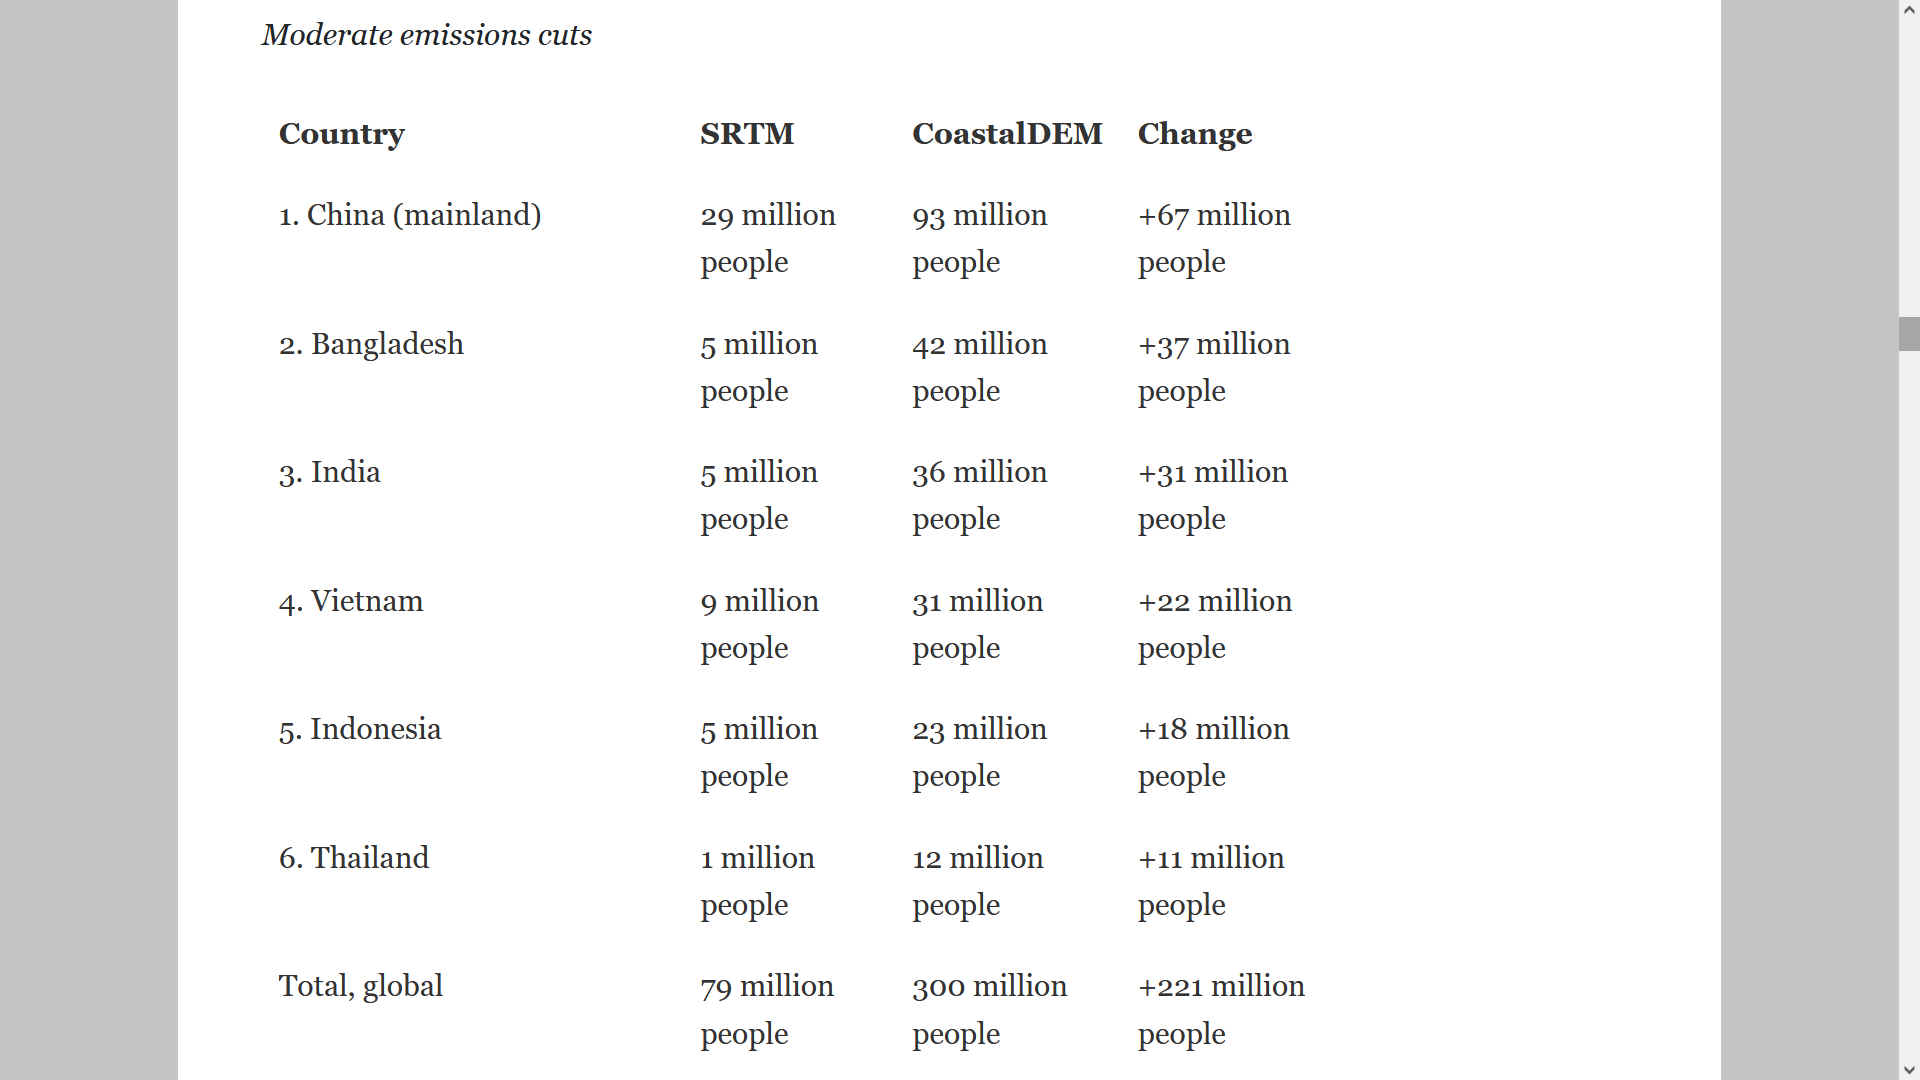
CHART
1. Current population below the elevation of an average annual flood in 2050, top six countries.
REFERENCES
Cassotta, S., Derkesen, C., Ekaykin, A., Hollowed, A., Kofinas, G., Mackintosh, A., Melbourne-Thomas, J., Muelbert, M.M.C., Ottersen, G., Pritchard, H., and Schuur, E.A.G. (2019). Chapter 3: Polar regions. In IPCC Special Report on the Ocean and Cryosphere in a Changing Climate [H.-O. Pörtner, D.C. Roberts, V. Masson-Delmotte, P. Zhai, M. Tignor, E. Poloczanska, K. Mintenbeck, M. Nicolai, A. Okem, J. Petzold, B. Rama, N. Weyer (eds.)].
https://www.ipcc.ch/site/assets/uploads/sites/3/2019/11/SROCC_FinalDraft_Chapter3.pdf
Church, J.A., P.U. Clark, A. Cazenave, J.M. Gregory, S. Jevrejeva, A. Levermann, M.A. Merrifield, G.A. Milne, R.S. Nerem, P.D. Nunn, A.J. Payne, W.T. Pfeffer, D. Stammer and A.S. Unnikrishnan. (2013). Sea Level Change. In: Climate Change 2013: The Physical Science Basis. Contribution of Working Group I to the Fifth Assessment Report of the Intergovernmental Panel on Climate Change [Stocker, T.F., D. Qin, G.-K. Plattner, M. Tignor, S.K. Allen, J. Boschung, A. Nauels, Y. Xia, V. Bex and P.M. Midgley (eds.)]. Cambridge University Press, Cambridge, United Kingdom and New York, NY, USA.
Church, J. A., and White, N. J. (2011). Sea-Level Rise from the Late 19th to the Early 21st Century. Surveys in Geophysics, 32(4-5), 585–602.
http://doi.org/10.1007/s10712-011-9119-1
Domingues, R., Goni, G., Baringer, M., & Volkov, D. (2018). What Caused the Accelerated Sea Level Changes Along the U.S. East Coast During 2010–2015? Geophysical Research Letters, 45(24), 13,367-13,376.
https://doi.org/10.1029/2018GL081183
IPCC, 2019: Summary for Policymakers. In: IPCC Special Report on the Ocean and Cryosphere in a Changing Climate [H.- O. Pörtner, D.C. Roberts, V. Masson-Delmotte, P. Zhai, M. Tignor, E. Poloczanska, K. Mintenbeck, M. Nicolai, A. Okem, J. Petzold, B. Rama, N. Weyer (eds.)]. In press.
https://report.ipcc.ch/srocc/pdf/SROCC_SPM_Approved.pdf
IPCC. (2013). Summary for Policymakers. In: Climate Change 2013: The Physical Science Basis. Contribution of Working Group I to the Fifth Assessment Report of the Intergovernmental Panel on Climate Change [Stocker,T.F., D. Qin, G.-K. Plattner, M. Tignor, S.K. Allen, J. Boschung, A. Nauels, Y. Xia, V. Bex and P.M. Midgley (eds.)]. Cambridge University Press, Cambridge, United Kingdom and New York, NY, USA.
http://www.ipcc.ch/pdf/assessment-report/ar5/wg1/WG1AR5_SPM_FINAL.pdf
Leuliette, E. (2014). The budget of recent global sea level rise: 1995-2013. Published by the National Oceanic and Atmospheric Administration.
http://www.star.nesdis.noaa.gov/sod/lsa/SeaLevelRise/documents/NOAA_NESD
NOAA Center for Operational Oceanographic Products and Services. (n.d.) Sea level trends. [online: https://tidesandcurrents.noaa.gov/sltrends/] Accessed November 18, 2019.
Parris, A., P. Bromirski, V. Burkett, D. Cayan, M. Culver, J. Hall, R. Horton, K. Knuuti, R. Moss, J. Obeysekera, A. Sallenger, and J. Weiss. (2012). Global Sea Level Rise Scenarios for the US National Climate Assessment. NOAA Tech Memo OAR CPO-1. 37 pp.
http://cpo.noaa.gov/sites/cpo/Reports/2012/NOAA_SLR_r3.pdf
Pelto, M. (2019). Alpine glaciers: Another decade of loss.
Realclimate.org.
http://www.realclimate.org/index.php/archives/2019/03/alpine-glaciers-another-decade-of-loss/
Sweet, W.V., Kopp, R.E., Weaver, C.P., Obeysekera, T., Horton, R.M., Thieler, E.R., and Zervas, C. (2017). Global and Regional Sea Level Rise Scenarios for the United States. NOAA Tech. Rep. NOS CO-OPS 083. National Oceanic and Atmospheric Administration, National Ocean Service, Silver Spring, MD. 75pp.
https://tidesandcurrents.noaa.gov/publications/techrpt83_Global_and_Regional_SLR_Scenarios_for_the_US_final.pdf
Sweet W. V., J. Park, J.J. Marra, C. Zervas and S. Gill (2014). Sea level rise and nuisance flood frequency changes around the U.S. NOAA Technical Report NOS CO-OPS 73, 53p. [Online: https://tidesandcurrents.noaa.gov/publications/NOAA_Technical_Report_NOS_COOPS_073.pdf]
SIX
(SUGGESTED) STEPS TOWARD A COOLER PLANET
1.
TRANSPORT:
Phase out polluting vehicles.
Governments aim to end the sale of new petrol,
and diesel
vehicles by 2040 but have no infrastructure plan to support such
ambition. Such infrastructure should exceed the performance of fossil
fuel filling stations, prolong EV
battery life and provide power grids with a measure of load leveling.
Any such system should seek to obviate the provision of millions of fast
charge points where implementation could prove to be a logistical
nightmare. This may involve international agreement as to energy storage
format and statute to steer car makers to collaborate in part in a world
of competition.
Marine
transport can be carbon
neutral given the right policies, with phased transition in specific
stages such as not to unduly penalize present investment in LNG
shipping
and other recent MARPOL
compliant IC
powered vessels. Future cargo vessel should be at least in part powered
by renewable energy, on the road to zero
carbon, making allowances for technology catch-up.
Air
travel powered by kerosene should attract hefty mitigation offset, where
low carbon alternatives should be encouraged.
2.
RENEWABLES:
Renewable
energy should replace carbon-based fuels (coal,
oil and
gas)
in our electricity for homes, factories, heating and transport. Coal
and nuclear
power plants should be phased out.
3.
HOUSING:
On site micro or macro
generation is the best option, starting with new build homes that are
both affordable and sustainable by design to replace crumbling housing
stocks. Encourage building in timber
to provide carbon lock from a renewable natural resource. Make
sustainable housing a permitted development, taking out the need to
apply for planning permission, will cut out council blockers from the
decision making process, to stamp out empire building agendas.
4.
AGRICULTURE:
We need to grow more trees
to absorb carbon emissions from a growing
population, air travel, and to build new homes. We should promote
reductions in food waste and eating of foods that use less energy to
produce. Educating children on these matters in schools and via
campaigns such as no
meat Mondays, should be part of ordinary study.
5.
INDUSTRY:
Factories should be aiming for solar heating and onsite renewable energy
generation. EV parking and even service facilities should be part of new
industrial estates as part of any building permissions.
6.
POLITICS:
- National governing bodies need
to adopt rules to eliminate administrative wastages, to include scaling
down spending on war machines, increasing spend on educating the public
and supporting sustainable social policies that mesh with other
cultures. This includes fostering policies and making funds available to
close links in the technology chain to make up for lost time. Kleptocratic
empire building must cease in the search for natural equilibrium.
CLIMATE
CHANGE COP HISTORY
|
1995
COP 1, BERLIN, GERMANY
1996
COP 2, GENEVA, SWITZERLAND
1997
COP 3, KYOTO, JAPAN
1998
COP 4, BUENOS AIRES, ARGENTINA
1999
COP 5, BONN, GERMANY
2000:COP
6, THE HAGUE, NETHERLANDS
2001
COP 7, MARRAKECH, MOROCCO
2002
COP 8, NEW DELHI, INDIA
2003
COP 9, MILAN, ITALY
2004
COP 10, BUENOS AIRES, ARGENTINA
2005
COP 11/CMP 1, MONTREAL, CANADA
2006
COP 12/CMP 2, NAIROBI, KENYA
2007
COP 13/CMP 3, BALI, INDONESIA
2008
COP 14/CMP 4, POZNAN, POLAND |
2009
COP 15/CMP 5, COPENHAGEN, DENMARK
2010
COP 16/CMP 6, CANCUN, MEXICO
2011
COP 17/CMP 7, DURBAN, SOUTH AFRICA
2012
COP 18/CMP 8, DOHA, QATAR
2013
COP 19/CMP 9, WARSAW, POLAND
2014
COP 20/CMP 10, LIMA, PERU
2015
COP 21/CMP 11, Paris, France
2016
COP 22/CMP 12/CMA 1, Marrakech, Morocco
2017
COP 23/CMP 13/CMA 2, Bonn, Germany
2018
COP 24/CMP 14/CMA 3, Katowice, Poland
2019
COP 25/CMP 15/CMA 4, Santiago, Chile
2020
COP 26/CMP 16/CMA 5, UK contenders (cancelled) 2021
COP 26, Glasgow, Scotland 2022
COP27, Egypt |
DESERTIFICATION COP HISTORY
|
COP 1: Rome, Italy, 29
Sept to 10 Oct 1997
|
COP 9: Buenos Aires,
Argentina, 21 Sept to 2 Oct 2009
|
|
COP 2: Dakar,
Senegal, 30
Nov to 11 Dec 1998
|
COP 10: Changwon, South
Korea, 10 to 20
Oct 2011
|
|
COP 3: Recife, Brazil, 15 to 26
Nov 1999
|
COP 11: Windhoek,
Namibia, 16 to 27
Sept 2013
|
|
COP 4: Bonn, Germany, 11 to 22
Dec 2000
|
COP 12: Ankara, Turkey, 12 to 23
Oct 2015
|
|
COP 5: Geneva,
Switzerland, 1 to 12
Oct 2001
|
COP 13: Ordos City,
China, 6 to 16
Sept 2017
|
|
COP 6: Havana, Cuba, 25 August to 5
Sept 2003
|
COP 14: New Delhi, India, 2 to 13
Sept 2019
|
|
COP 7: Nairobi, Kenya, 17 to 28
Oct 2005
|
COP 15: 2020
|
|
COP 8: Madrid, Spain, 3 to 14
Sept 2007
|
COP 16: 2021
|
BIODIVERSITY
COP HISTORY
|
COP
1: 1994 Nassau,
Bahamas, Nov & Dec
|
COP
8: 2006
Curitiba, Brazil, 8 Mar
|
|
COP
2: 1995
Jakarta, Indonesia, Nov
|
COP
9: 2008 Bonn,
Germany, May
|
|
COP
3: 1996 Buenos
Aires, Argentina, Nov
|
COP
10: 2010
Nagoya, Japan, Oct
|
|
COP
4: 1998
Bratislava, Slovakia, May
|
COP
11: 2012
Hyderabad, India
|
|
EXCOP:
1999 Cartagena, Colombia, Feb
|
COP
12: 2014
Pyeongchang, Republic of Korea, Oct
|
|
COP
5: 2000
Nairobi, Kenya, May
|
COP
13: 2016
Cancun, Mexico, 2 to 17 Dec
|
|
COP
6: 2002 The
Hague, Netherlands, April
|
COP
14: 2018
Sharm El-Sheikh, Egypt, 17 to 29 Nov
|
|
COP
7: 2004 Kuala
Lumpur, Malaysia, Feb
|
COP
15: 2020 Kunming, Yunnan, China
|
UN
CLIMATE ACTION PORTFOLIOS
1.
Finance
2. Energy
Transition
3. Industry
Transition
4. Nature-Based
Solutions
5. Cities and Local
Action
6. Resilience and
Adaptation
7. Mitigation
Strategy
8. Youth Engagement
& Public Mobilization
9. Social and Political
Drivers